GK-2A IR Colour Enhancement
Since its commissioning on July 25th 2019, GEO-KOMPSAT-2A (GK-2A) has been downlinking Full Disk images every 10 minutes over LRIT and HRIT. Unfortunately the LRIT downlink only transmits a single Infrared channel called IR105 (10.4μm) due to bandwidth constraints. This means false colour imagery cannot be created using data from the LRIT downlink alone.
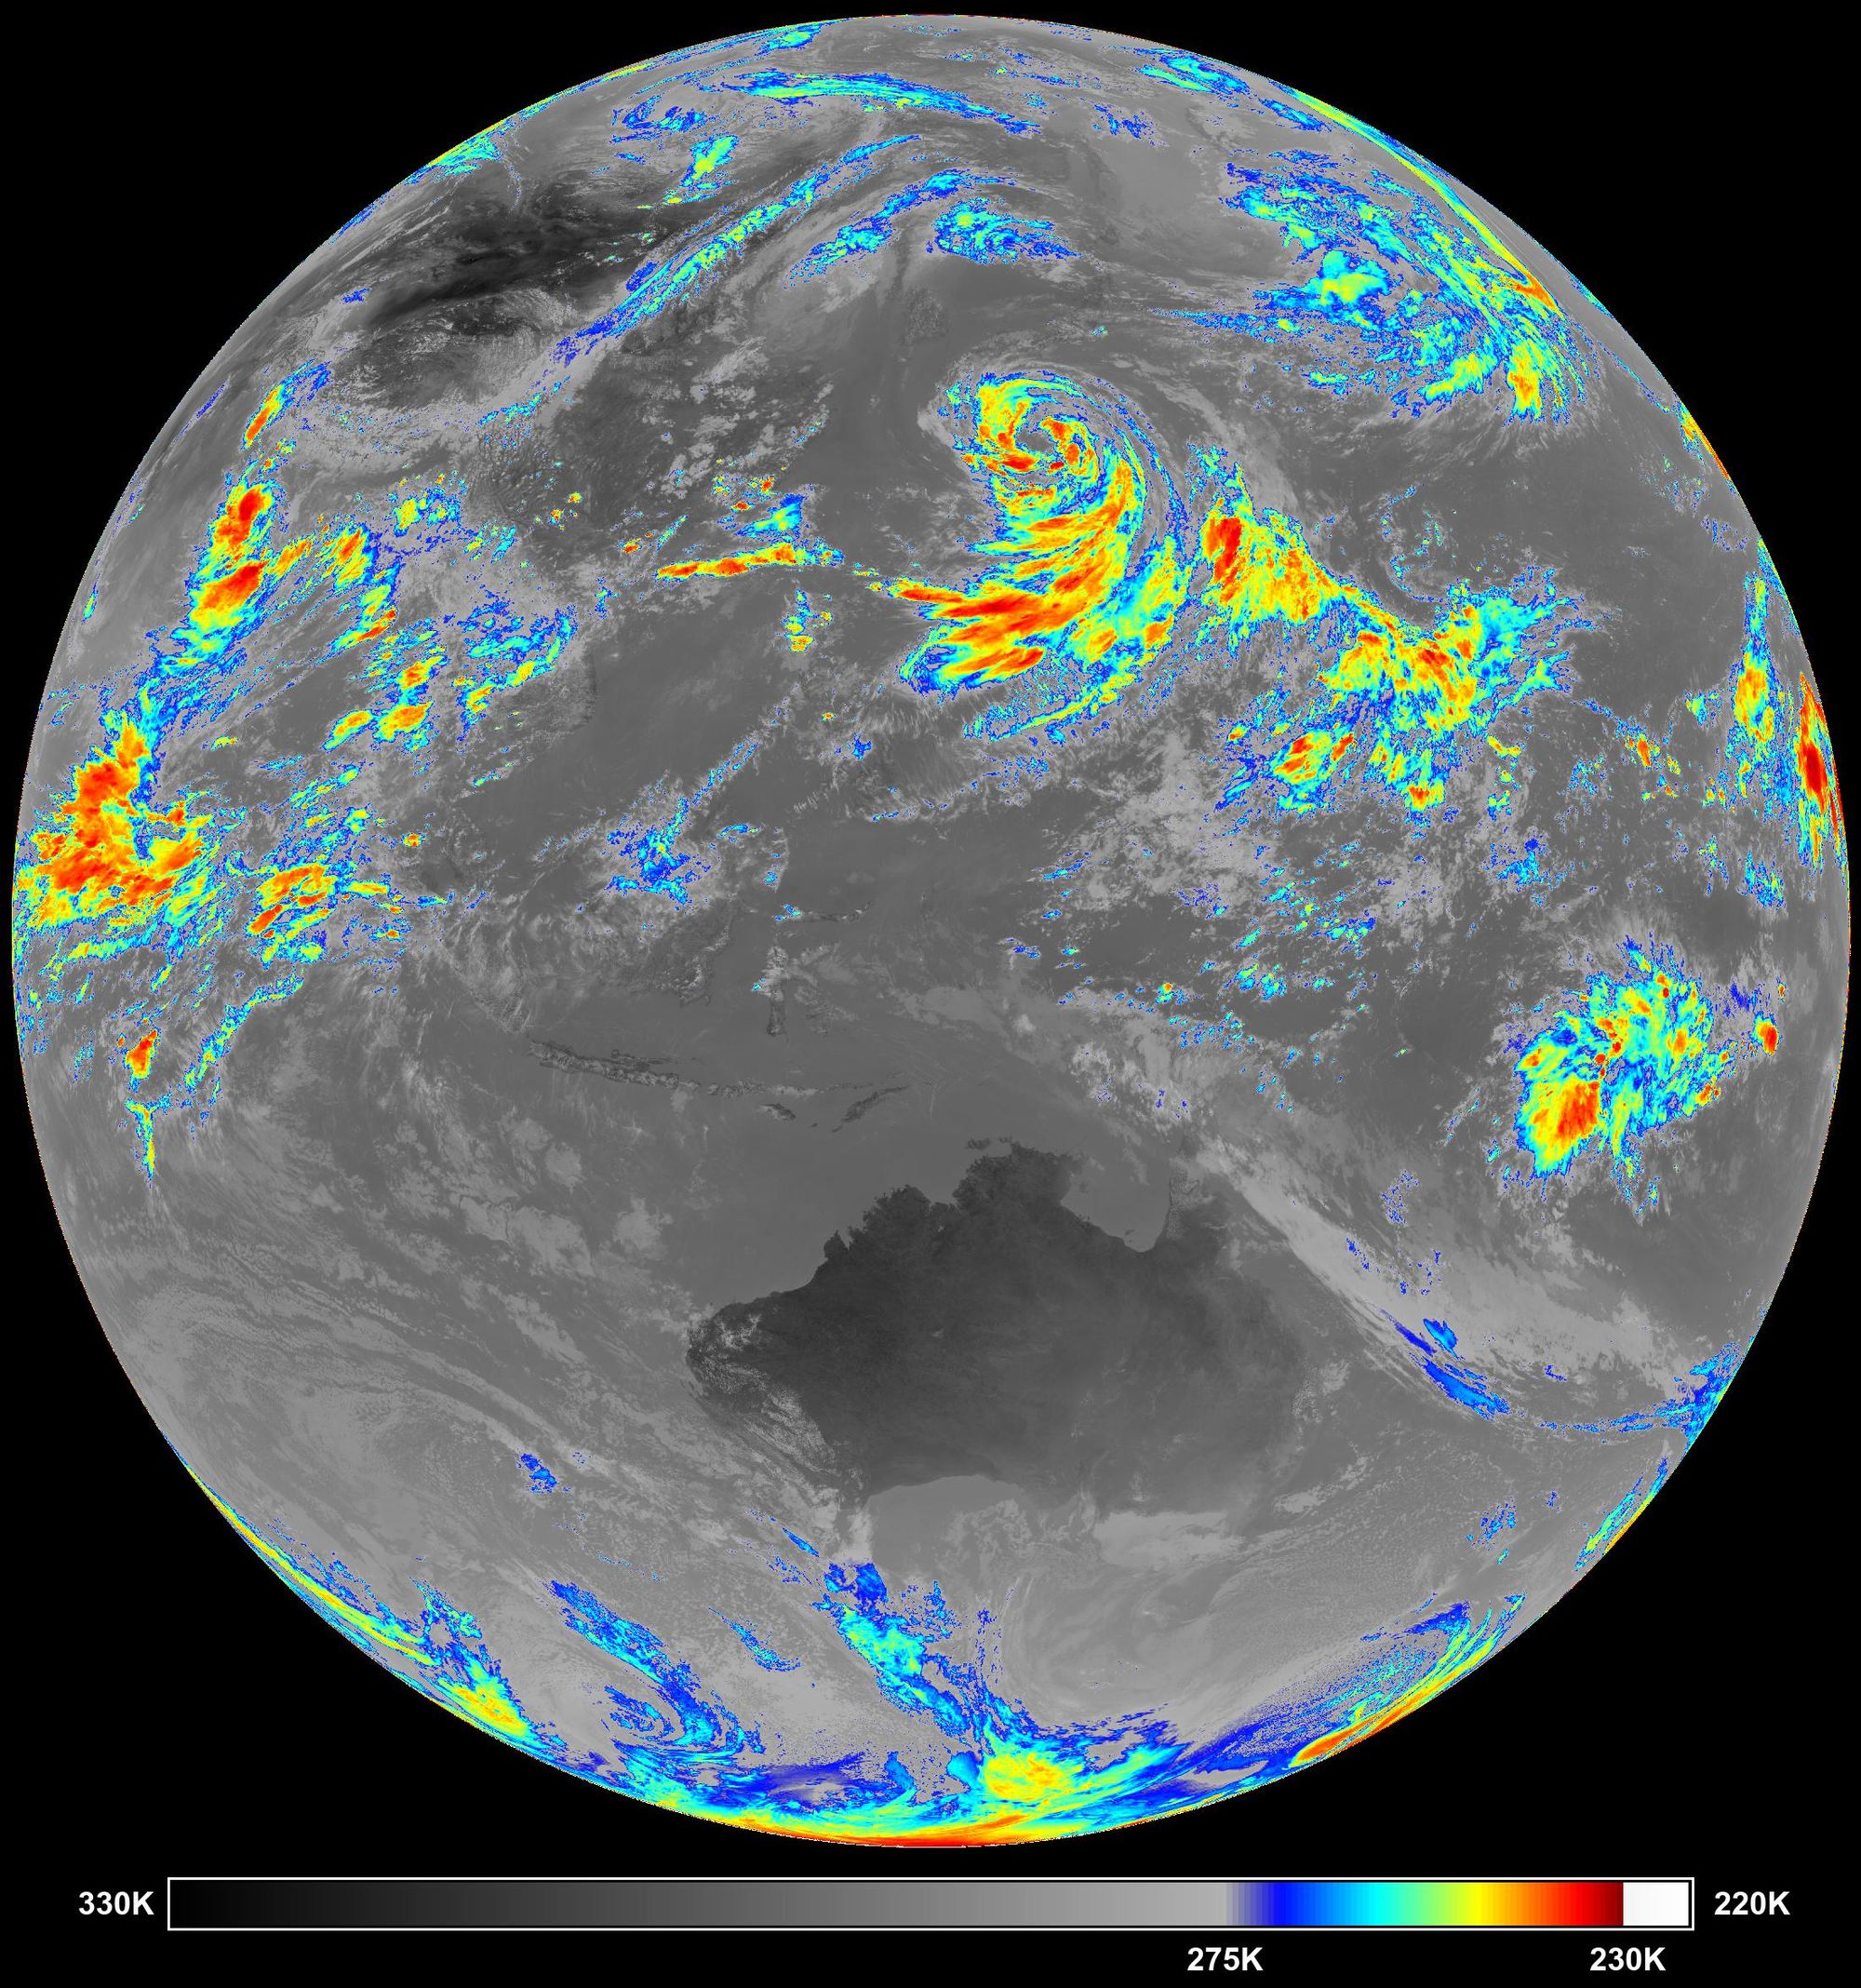
However, interesting imagery can still be created from this single channel using Infrared Colour Enhancement. This process replaces a range of grayscale values in infrared imagery with a colour gradient. Metrologists use this to show the severity of weather systems in thermal infrared imagery.
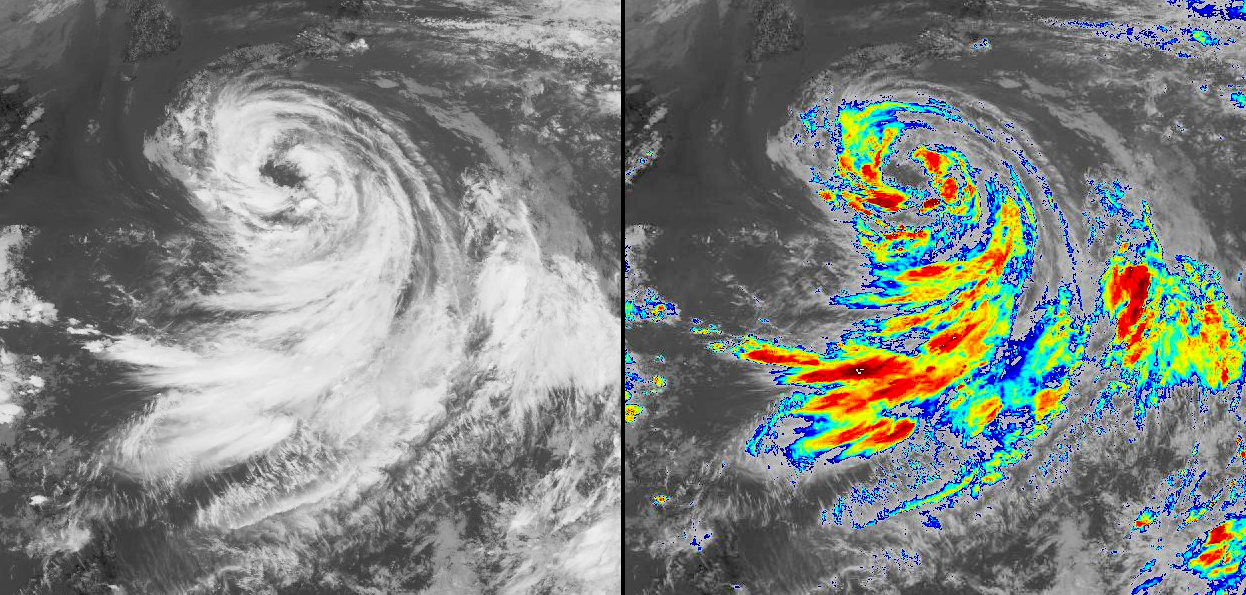
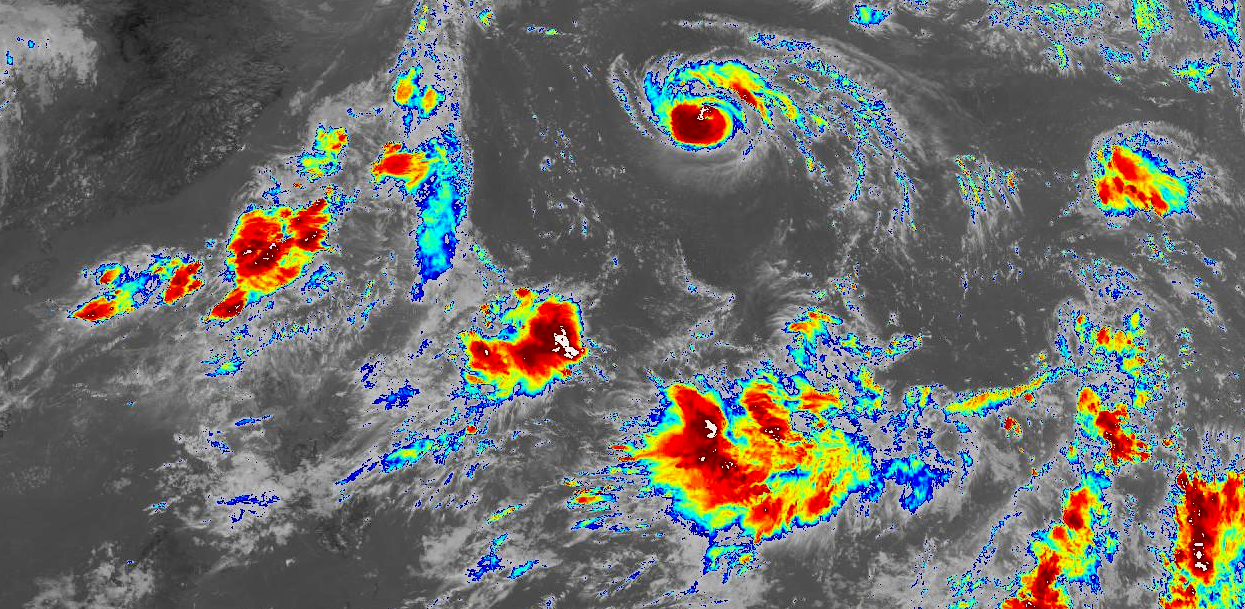
In typical thermal infrared imagery the brightness increases as temperature decreases, meaning the strongest (coldest) weather systems appear the brightest. Much of the detail in the above imagery of Typhoon Krosa is washed out near the eye of the system (coldest area). A considerable amount of detail is revealed after colour enhancement of the brighter regions.
Enhanced animation of Typhoon Krosa (13/08/2019)
Enhancement Code
The enhance-ir.py Python script in the xrit-rx GitHub repository applies this colour enhancement to GK-2A infrared imagery using Pillow and NumPy. To install these packages run:
> pip3 install pillow numpy
Basic usage of enhance-ir.py requires only an input image path. After processing, an output image will be saved in the same folder as the input image with _ENHANCED appended to the file name.
> python3 enhance-ir.py in.jpg
Multiple images can be processed at once by setting the input path to a folder rather than an individual file. The script will scan the input folder for files that match IMG_*.jpg (ignoring file names with _ENHANCED) and process them into individual output images.
> python3 enhance-ir.py images
Below is a list of optional arguments for the script which are used to change the look of the final output image:
usage: enhance-ir.py [-h] [--hot HOT] [--cold COLD] [-s] [-o] [-t] INPUT
| Argument | Description |
|---|---|
-h |
Show this help message |
--hot |
Hotter (darker) threshold in Kelvin (275K by default) |
--cold |
Colder (brighter) threshold in Kelvin (230K by default) |
-s |
Disable drawing of the LUT and text below the image |
-t |
Output only enhanced pixels to a transparent PNG |
-o |
Overwrite any images in the output folder |
Enhancement Process
The actual process of applying colour enhancement to an image is relatively simple. It requires three components: a grayscale input image, calibration table, and colour look-up table.
Calibration Table
The calibration table is sent with every every thermal infrared image downlinked by GK-2A. This table describes the relationship between pixel brightness and temperature in Kelvin.
NAME:=IR105
UNIT:=KELVIN
0:=330.05254
1:=319.99371
2:=309.08976
3:=297.08050
4:=283.54929
5:=267.75568
6:=248.14399
7:=220.17763
The 8 equally spaced values in the table provide very a coarse conversion between pixel brightness and temperature. This table is interpolated for a smoother conversion and to match the total number of possible pixel brightness values in the input image. In the case of 8-bit GK-2A LRIT imagery, there are a total of 256 possible pixel brightness values.
# Setup interpolation points
xp = []
for i in range(len(cal)):
    m = 256 / len(cal)
    xp.append((i+1) * m)

# Interpolate conversion table
for i in range(256):
    k = round(np.interp(i, xp, cal), 3)

    # Append interpolated temperature value
    kelvin.append(k)
This interpolated table allows selective enhancement of brighter or darker parts of the input image by specifying a temperature range in Kelvin, then using the table to convert that temperature to a pixel brightness value.
Colour Look-up Table
The Colour Look-up Table (CLUT) defines the colours used to enhance the input image. In this case it is an 8-bit RGB gradient with 256 colours starting at blue and ending at red.
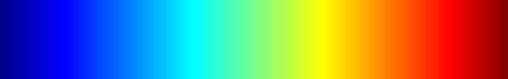
This CLUT is scaled to match the size of the temperature range specified by the user, which is 45K by default (275K to 230K). The above calibration table is used to find the nearest pixel brightness value to the temperatures specified by the user. Then a scale factor (scale) is calculated from the indexes of those pixel brightness values (hotI, coldI). Finally a new scaled CLUT (sclut) is generated by sampling the full size CLUT at regular intervals spaced out by multiples of the scale factor.
# Find nearest Kelvin CLUT bounds indicies
hotI = get_nearest(float(args.hot), kelvin)
coldI = get_nearest(float(args.cold), kelvin)

# Get scale factor for CLUT
scale = (len(clut) / (coldI - hotI))

# Scale CLUT
sclut = []
for i in range(coldI - hotI):
    idx = round(i * scale)
    if idx > 255: idx = 255
    sclut.append(clut[idx])
Next, an 8-bit grayscale LUT is generated as a base for the scaled CLUT to be overlayed onto.
# Generate base 8-bit grayscale LUT
for i in range(256):
    lut.append((i, i, i))
Then the scaled CLUT is overlayed on the grayscale LUT. The lower bound of the CLUT is cross-faded with the grayscale LUT to create a smoother transition to enhanced areas in the output image.
# Insert CLUT into LUT
for i in range(len(sclut)):
    cf = 10
    if i <= cf:
        # Crossfade LUTs
        r = int(sclut[i][0] * (i / cf)) + int(lut[hotI + i][0] * ((cf - i) / cf))
        g = int(sclut[i][1] * (i / cf)) + int(lut[hotI + i][1] * ((cf - i) / cf))
        b = int(sclut[i][2] * (i / cf)) + int(lut[hotI + i][2] * ((cf - i) / cf))
        lut[hotI + i] = (r, g, b)
    else:
        lut[hotI + i] = sclut[i]
This produces the final LUT which will be applied to the input image.

Final Image
The final LUT is separated into red, green and blue channels before being applied to the input image. It is far easier to deal with the channels individually rather than as an array of (r, g, b) Tuples.
Each channel of the final LUT is then applied to the input image which creates three enhanced channels. These channels are now reassembled into the final RGB image.
# Create empty NumPy arrays for each channel
nplutR = np.zeros(len(lut), dtype=np.uint8)
nplutG = np.zeros(len(lut), dtype=np.uint8)
nplutB = np.zeros(len(lut), dtype=np.uint8)

# Convert LUT channels into separate NumPy arrays
for i, c in enumerate(lut):
    nplutR[i] = c[0]
    nplutG[i] = c[1]
    nplutB[i] = c[2]

# Get grayscale values from input image
gray = np.array(input)

# Apply each channel of LUT to grayscale image
enhR = nplutR[gray]
enhG = nplutG[gray]
enhB = nplutB[gray]

# Convert enhanced arrays to images
iR = Image.fromarray(enhR)
iG = Image.fromarray(enhG)
iB = Image.fromarray(enhB)

# Combine enhanced channels into an RGB image
i = Image.merge("RGB", (iR, iG, iB))
If the -s option is not set, the final LUT and temperature values will also be drawn at the bottom of the output image.
Further Reading
Convection Working Group: Color Enhancements
Convective Storms: Enhancing and color-enhancing satellite imagery